Results and exports
After clicking Search in the report builder, results appear below the query. This page explains how to read and page through the results table, sort and filter it, add aggregate totals, and export the data. To learn how to build the query, see Build a report.
The results table
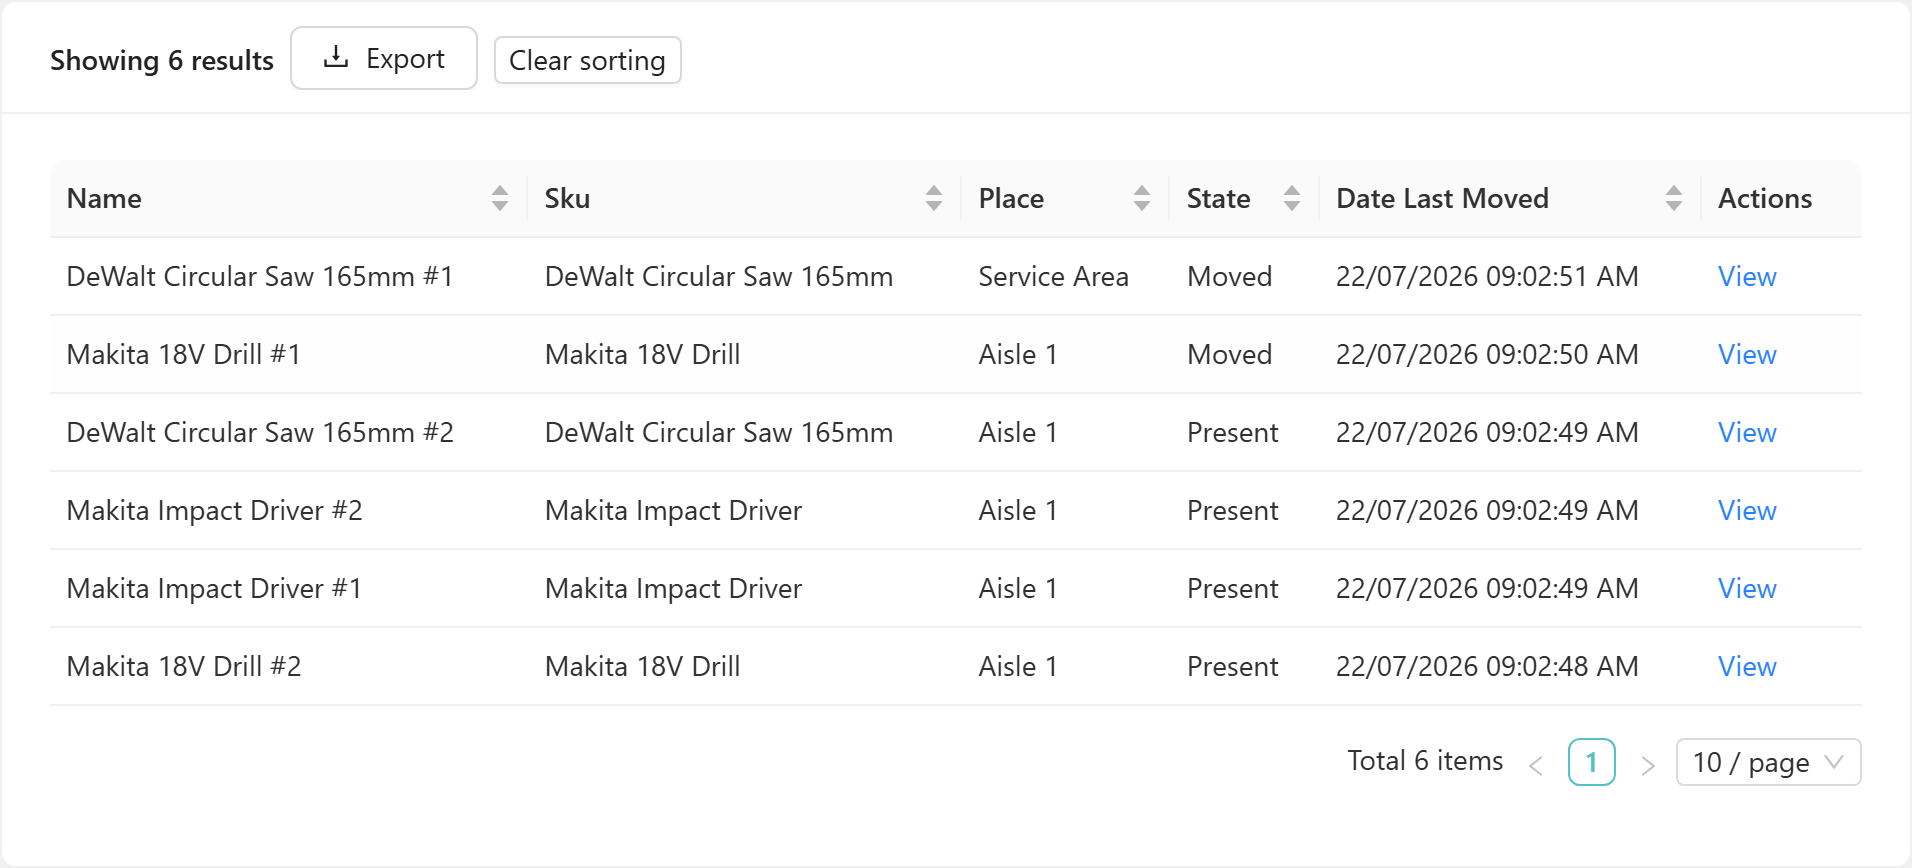
The results area shows a card header with Showing N results — the count of records matched by your query — alongside an Export button and a Clear sorting button. The table displays one record per row, using the columns you selected in Step 3 of the builder, followed by an Actions column.
Pagination
The footer reads Total N items and shows the current page position. Use the arrow buttons to move between pages. The page-size selector lets you display 10, 25, 50, or 100 rows per page.
Opening a record
Click View in the Actions column to open the full record page for that row — for example, the item detail page for a row in an Items report. The View link appears only when you have permission to view records of that type.
Sorting
Click a column header to sort by that column. On an Advanced report, the portal re-queries the server to apply the sort across all pages. On a Basic report, the rows already loaded are re-sorted locally without a new server request. Click the same header again to reverse the direction.
Click Clear sorting to remove all sorting and return to the default order.
Column filters
Column filters are available on Basic report types (such as Items Report, Item Movement History, and similar) only. Advanced reports do not have column filters.
On a Basic report result, plain-text columns display a funnel icon in the column header. Click the icon to open a filter input directly beneath the header and type any substring to match against — the filter is case-insensitive. When more than one column filter is active, rows must satisfy all of them (AND logic).
The filter icon appears only on plain-text columns such as State. Picker-style columns such as Name, which resolve to linked records, do not offer a column filter.
Example: Typing Present into the State column filter narrows the table to the 8 rows whose State value contains that text. The card updates to Showing 8 results and a Clear filters button appears alongside Clear sorting.
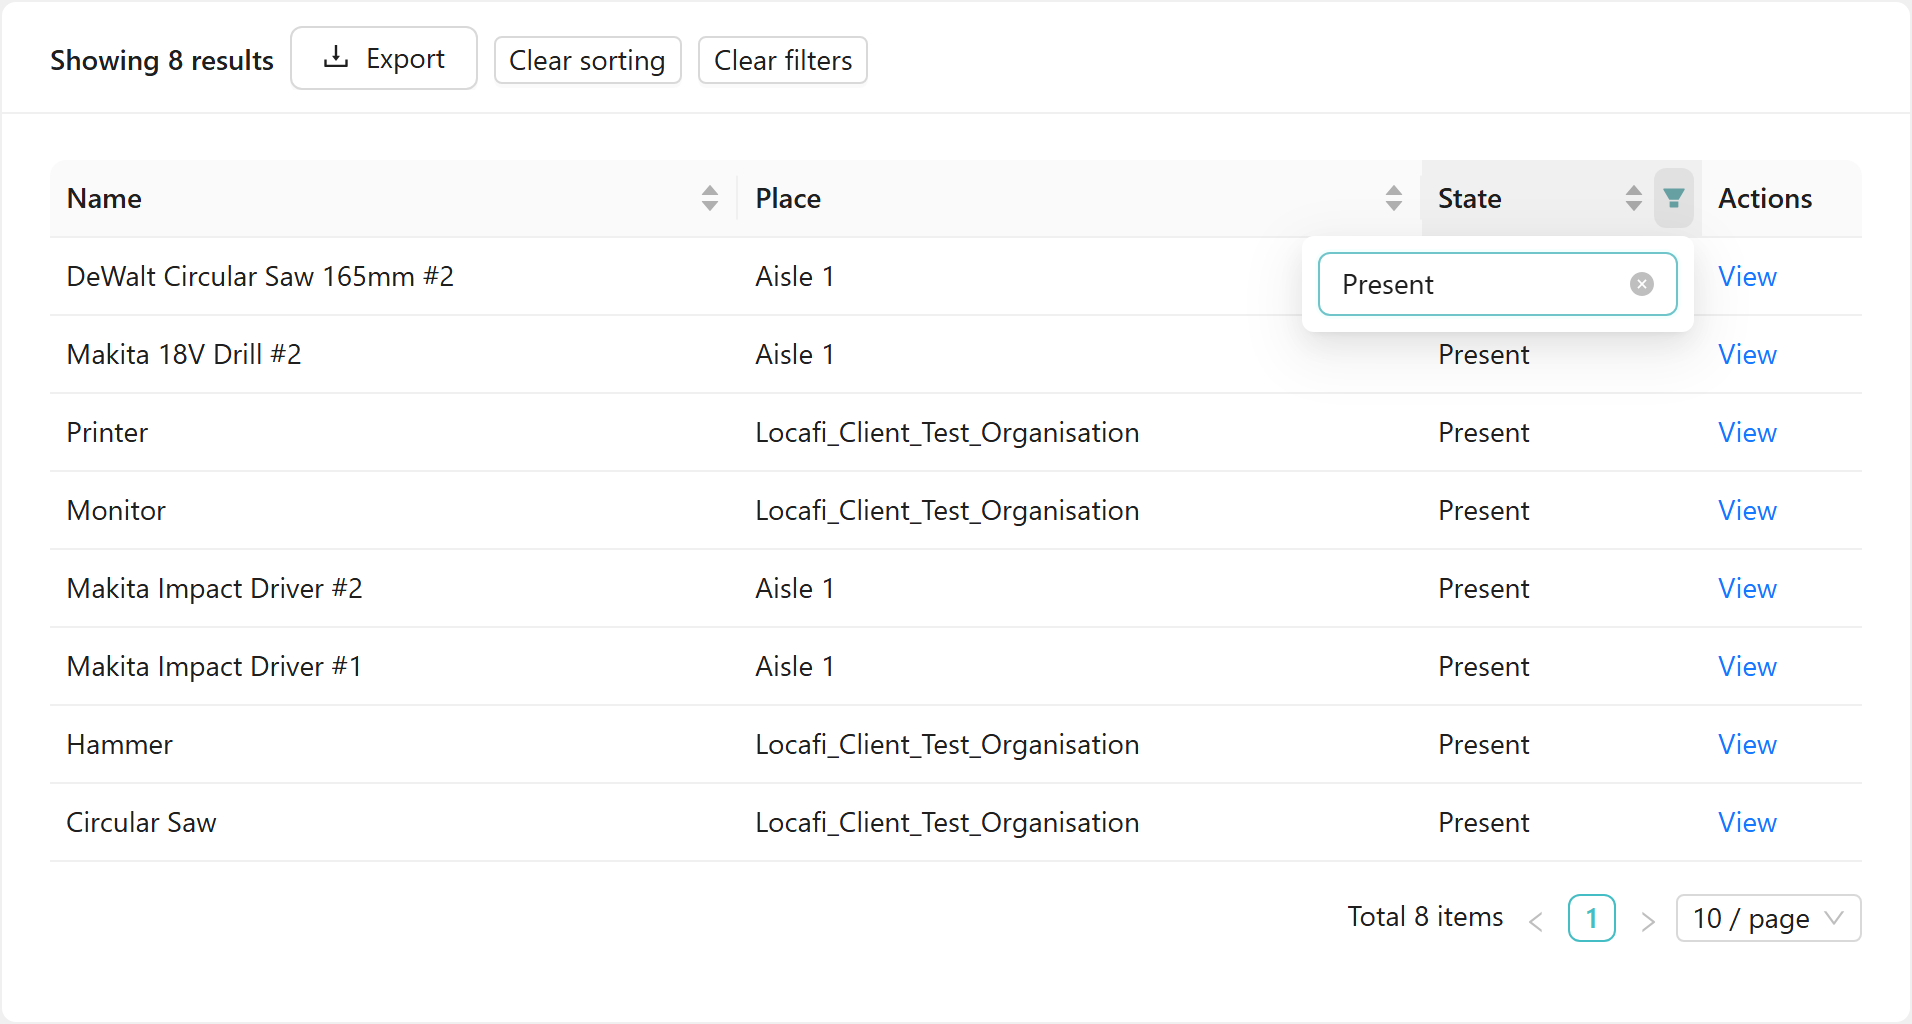
Click Clear filters to remove all active column filters and show the full result set again.
Aggregates
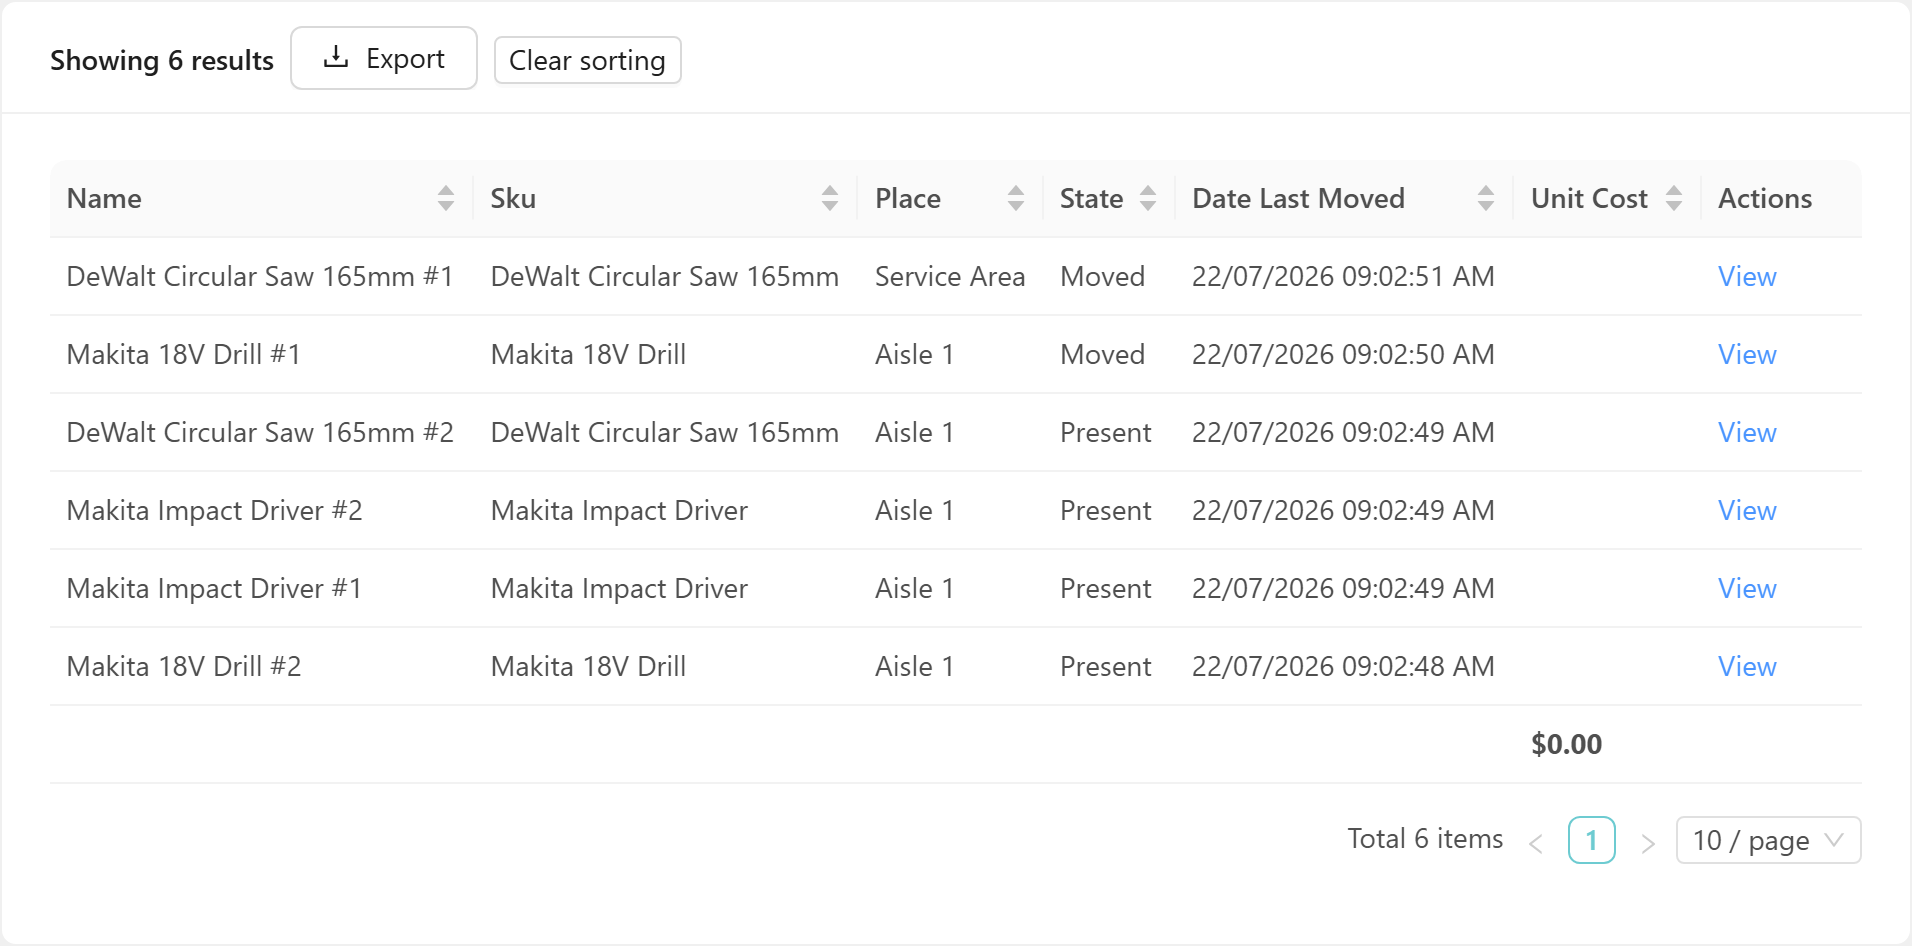
The Show Aggregates switch adds a totals row to the results table. When the switch is on, each numeric column gains a Sum / Avg dropdown with the placeholder None. Select Sum or Avg from the dropdown for any column you want to total; a bold totals row appears below the last data row and displays the computed value.
Aggregate totals are calculated across all result rows, not only the rows visible on the current page or the rows remaining after a column filter is applied.
Example: The screenshot below shows Sum selected for the Unit Cost column, with a bold totals row at the bottom. The value shows $0.00 because the demo items in this report carry no unit cost; in a real dataset the totals row reflects whatever values your data holds.
Exporting
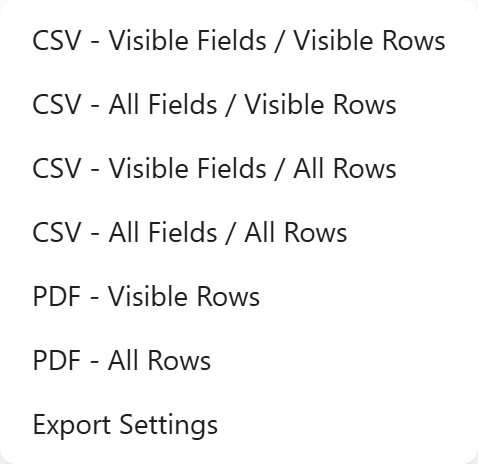
Click Export to open the export menu. Seven options are available:
| Option | What it exports |
|---|---|
| CSV - Visible Fields / Visible Rows | Your Step-3 columns, current page only |
| CSV - All Fields / Visible Rows | Every available column for the report type, current page only |
| CSV - Visible Fields / All Rows | Your Step-3 columns, across all pages |
| CSV - All Fields / All Rows | Every available column, across all pages |
| PDF - Visible Rows | A PDF of the current page, using a print template |
| PDF - All Rows | A PDF of all pages, using a print template |
| Export Settings | Opens the export settings modal — see Export Settings below |
Visible Fields are the columns you added in Step 3 of the builder, in the order you arranged them. All Fields includes every column available for the chosen report type, including columns you did not select. Visible Rows is the current page. All Rows is every record matched by your query, across all pages.
Large exports
When you select an All Rows option on an Advanced report with more than 200 rows, a confirmation dialog titled Export Data opens. It reads: You are exporting a large amount of data… Click Yes, continue to proceed, or cancel to go back.
PDF exports
Choosing PDF - Visible Rows or PDF - All Rows opens the Select Print Template dialog. Choose a template from the dropdown (placeholder Select a template...), then click OK to download the PDF.
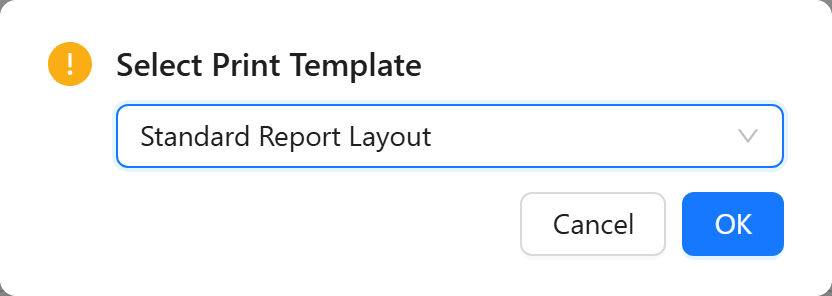
Print templates are configured by an administrator. If no templates have been set up, the dropdown is empty and no PDF can be generated until an administrator adds one.
Export Settings
The Export Settings option opens a modal that controls how CSV exports are formatted.
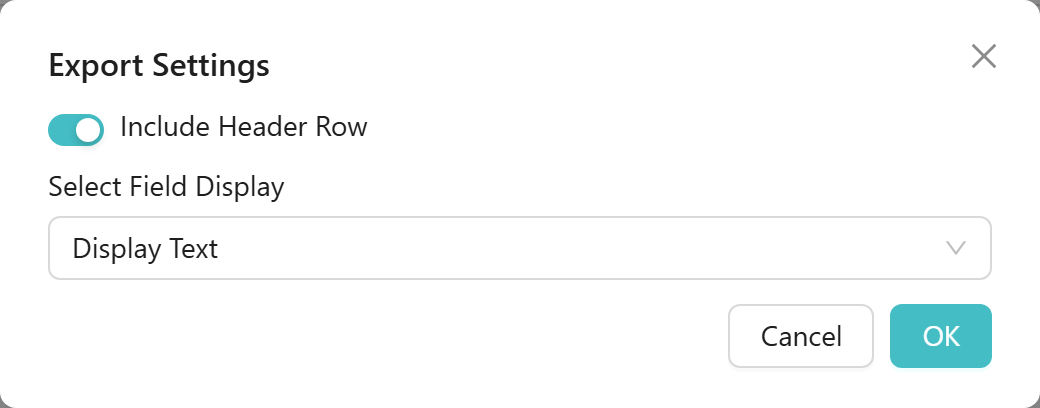
| Setting | Options | Effect |
|---|---|---|
| Include Header Row | On (default) / Off | When on, the first row of the CSV contains the column names |
| Select Field Display | Display Text / Value / Both | Controls how choice-field columns (such as State or Tag Type) are written in the CSV. Display Text writes the label the portal shows. Value writes the underlying stored value. Both writes both |
Click OK to save your settings. They apply to all subsequent CSV exports until you change them again.
Related guides:
- Build a report — step-by-step walkthrough of the query builder, from choosing a report type through to running the search.
- Filters and operators — the full reference for filter operators, date keywords, and text-match options.
- Working with lists — how to sort, filter, and export data in standard list views; note that list exports and report exports are separate features with different column and format options.